May
For most of irrigation’s history in urban and commercial settings, managing water was largely a matter of estimation. Landscape contractors worked from experience, property managers relied on set-it-and-forget-it schedules, and the first real signal that something had gone wrong was usually a utility bill, a tenant complaint, or a patch of stressed turf. The feedback loop was slow by design, because the tools available offered no other option.
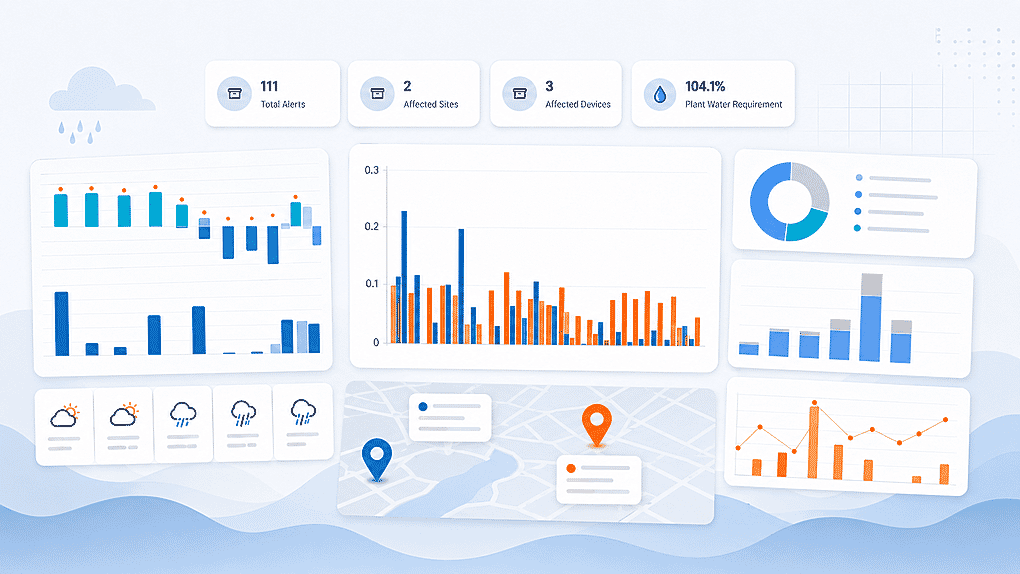
Smart irrigation systems changed the underlying hardware. Modern dashboards complete the picture by making what those systems know visible, actionable, and manageable at scale. Here are five things that combination helps managers actually see.
Where water use is highest across a portfolio
Smart controllers generate a continuous record of irrigation activity across every zone they manage. A dashboard puts that data in one place, allowing managers to compare consumption across properties, sites, and controllers without cross-referencing meter reads or digging through utility invoices. When one property trends significantly above comparable sites, that signal surfaces early rather than arriving as a billing surprise. For organizations managing large commercial portfolios, HOA communities, or municipal landscapes, that kind of consolidated visibility is something manual processes simply cannot replicate.
Where water is being applied inappropriately
Smart systems are designed to respond to actual conditions rather than fixed schedules, but they still benefit from professional oversight. The question in commercial and professional landscape management is rarely whether water is reaching the landscape. It is whether the right amount is being applied, to the right areas, at the right time. Dashboards surface the patterns that answer those questions: runtimes extending beyond reasonable parameters, zones behaving inconsistently with their design intent, or areas receiving more or less water than site conditions call for. For property managers and contractors responsible for maintaining appearance standards, catching those patterns early makes a material difference in both landscape performance and client confidence.
Which systems and controllers need attention
Smart controllers can detect and report a range of system-level conditions that older equipment would never surface on its own. A dashboard brings those signals together in a single operational view, allowing managers to see offline controllers, communication issues, flow anomalies, and irregular behavior across an entire portfolio without waiting for a site visit or a client call. In commercial irrigation management, reactive maintenance carries real costs. For contractors managing a large book of properties, that earlier line of sight means fewer emergency responses, better-prepared technicians, and a more consistent standard of service across every account.
What water use is actually costing in near real time
Smart systems track consumption continuously, and dashboards make that data meaningful in financial terms. Water costs in commercial and municipal settings have risen consistently across most regions, and they remain one of the more controllable line items in a landscape maintenance budget. The challenge has always been that utility bills present those costs after the fact. By the time a property manager or HOA board reviews a statement, the decisions driving that number are weeks in the past. Dashboards connect daily irrigation activity to its financial implications in something closer to real time, giving organizations managing multiple properties or operating under sustainability mandates a much stronger basis for planning and accountability.
How weather is driving smart system decisions and whether those decisions are working
Modern smart irrigation systems are built to respond to weather. They adjust schedules based on evapotranspiration rates, hold cycles when rainfall thresholds are met, and modify runtime durations as temperature and humidity shift. A dashboard makes those automated decisions visible, turning what would otherwise be a black box into something a manager can actually review and evaluate. Did the system hold correctly after last week’s rain? Are ET-based adjustments producing the usage reduction they should? Is a particular site responding to weather conditions the way comparable properties are? That level of insight is what separates a smart system being monitored from a smart system being managed. The goal is not just automation, but accountability for what the automation is doing.
The common thread across all these five things is that smart systems generate far more information than any manager could collect manually. Dashboards are how that information becomes useful, turning a distributed network of connected controllers into a coherent, manageable picture. That shift, from reactive and fragmented to informed and integrated, is what the combination of smart irrigation and modern dashboards is designed to support.
You can see how the Husqvarna Water Management System dashboard was designed, as one example, to provide greater visibility into irrigation performance, water use, controller activity, overwatering trends, water cost tracking, and long-term reporting across sites and properties.